
Chrome Developer Tools is widely used by developers to help edit pages on-the-fly and diagnose issues. Pardot users can use DevTools to troubleshoot and test landing pages and forms. In this post, I’ll show you 7 ways you can use DevTools, including how to identify errors on a landing page, how to customize the CSS of a form and how to view hidden form field values.
How to open DevTools
Right-click an element on the page and select Inspect to jump into the Elements panel. Or press Command+Option+C (Mac) or Control+Shift+C (Windows, Linux, Chrome OS).
1. Clearing cookies
You can use DevTools to easily clear your cookies when testing forms or tracking. This allows you to easily select the specific cookie on a specific domain without clearing all your browser cookies.
To clear your cookies. Open DevTools and navigate to the Application tab. Select Cookies from the tree and select your Pardot subdomain. Click on the specific cookie to delete it or click on the icon to delete all cookies associated to that domain or subdomain.
![]()
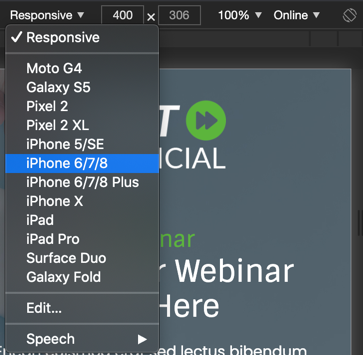
2. Testing the mobile version directly in your browser
If your Pardot landing pages are responsive, you can test the mobile or tablet version directly in your browser.

3. Indentifying the errors on your landing page
Identify errors on your page by looking at the console tab. This will display any broken files (images, CSS files, etc) that are present on the page. It will also show you any Javascript errors or security warnings. Warnings are displayed with a yellow icon and errors are displayed with a red icon.
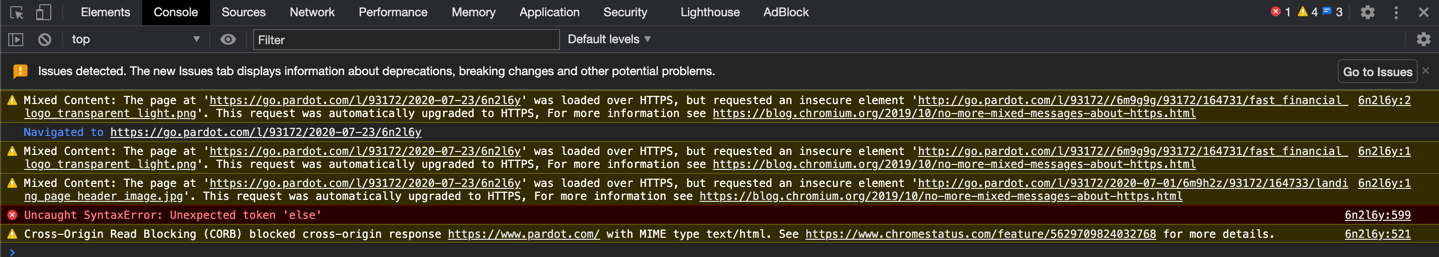
Learn more about fixing issues with Chrome →
4. Inspecting HTML
An alternative to viewing the source of your Pardot landing page is to use Chrome DevTools to easily inspect the HTML of the page. To use the inspector tool, click mouse icon and then select an element on the page to view the HTML.
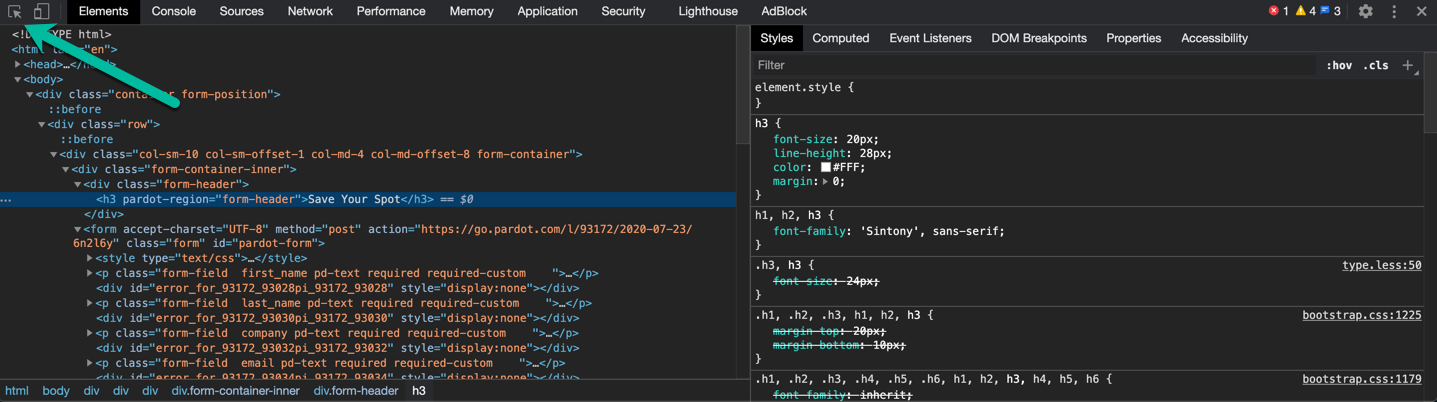
Learn more about using the inspector →
5. Identifying the CSS Selectors for your forms
Pardot forms come with their own set of classes and IDs. One of the key parts of customizing your Pardot forms is knowing which class or ID to use within your CSS. Using the DevTools inspector, you can easily view the IDs and the classes by selecting the element and viewing the HTML of the form.

6. Testing code before you push it live
Want to change the color of a button on the fly? Or preview what the page will look like with a bigger font? You can do these directly within your browser before making the changes to your layout template in Pardot. Select the element using the inspector and navigate to the styles tab. Modify the CSS within the styles section for the element and watch it change automatically on the page.
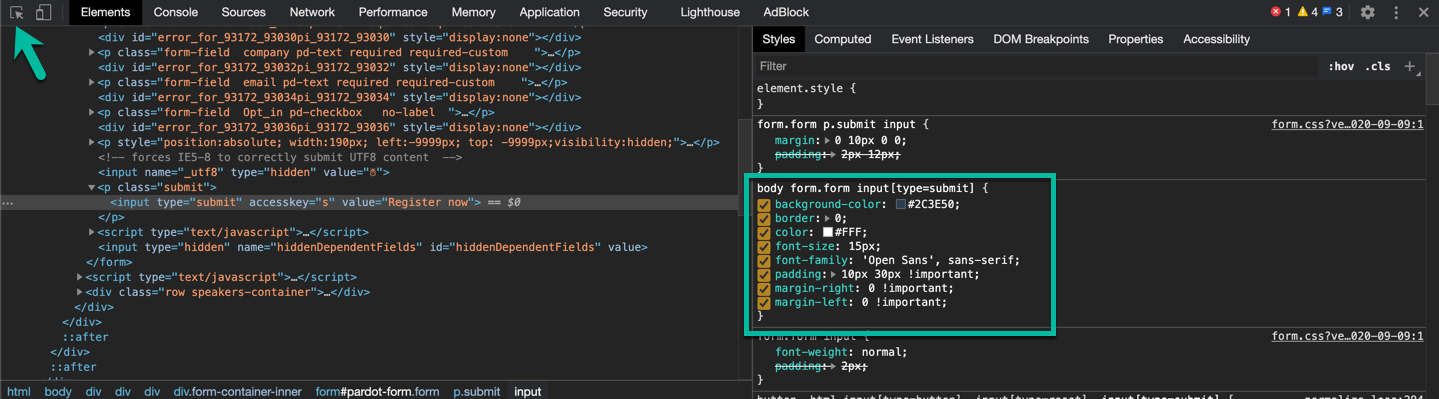
An advanced way to modify the styles of a page is to navigate to the source tab, select a CSS file and add or modify your CSS.

Learn more about using the inspector to view and modify CSS →
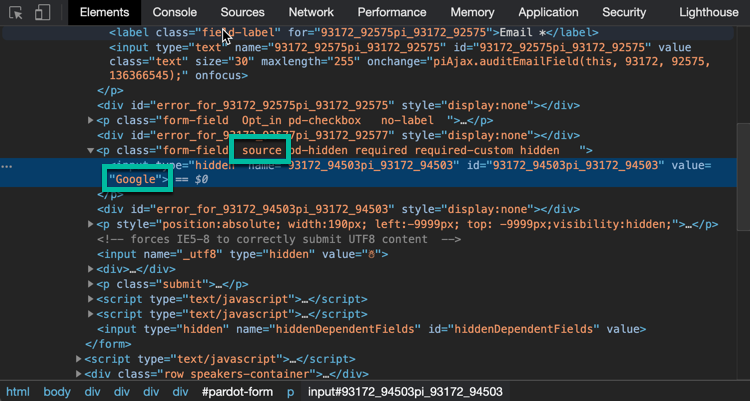
7. Viewing hidden form fields
You can easily view hidden fields and their values using the inspector. This comes in handy when testing if your UTM parameters or lead source are populating correctly, without filling out the form everytime.
Questions?
Send me a tweet @jennamolby, or leave a comment