
Did you know you can add report charts to your campaign page layout in Salesforce? Adding report charts will give you insight into a particular campaign’s performance without creating a separate report or leaving the campaign page.
These reports can show you how many campaign members were added, by month or by status, how many opportunities are influenced by the campaign by opportunity stage, etc. All this is made easy by customizing your campaign lightning record page.
Example
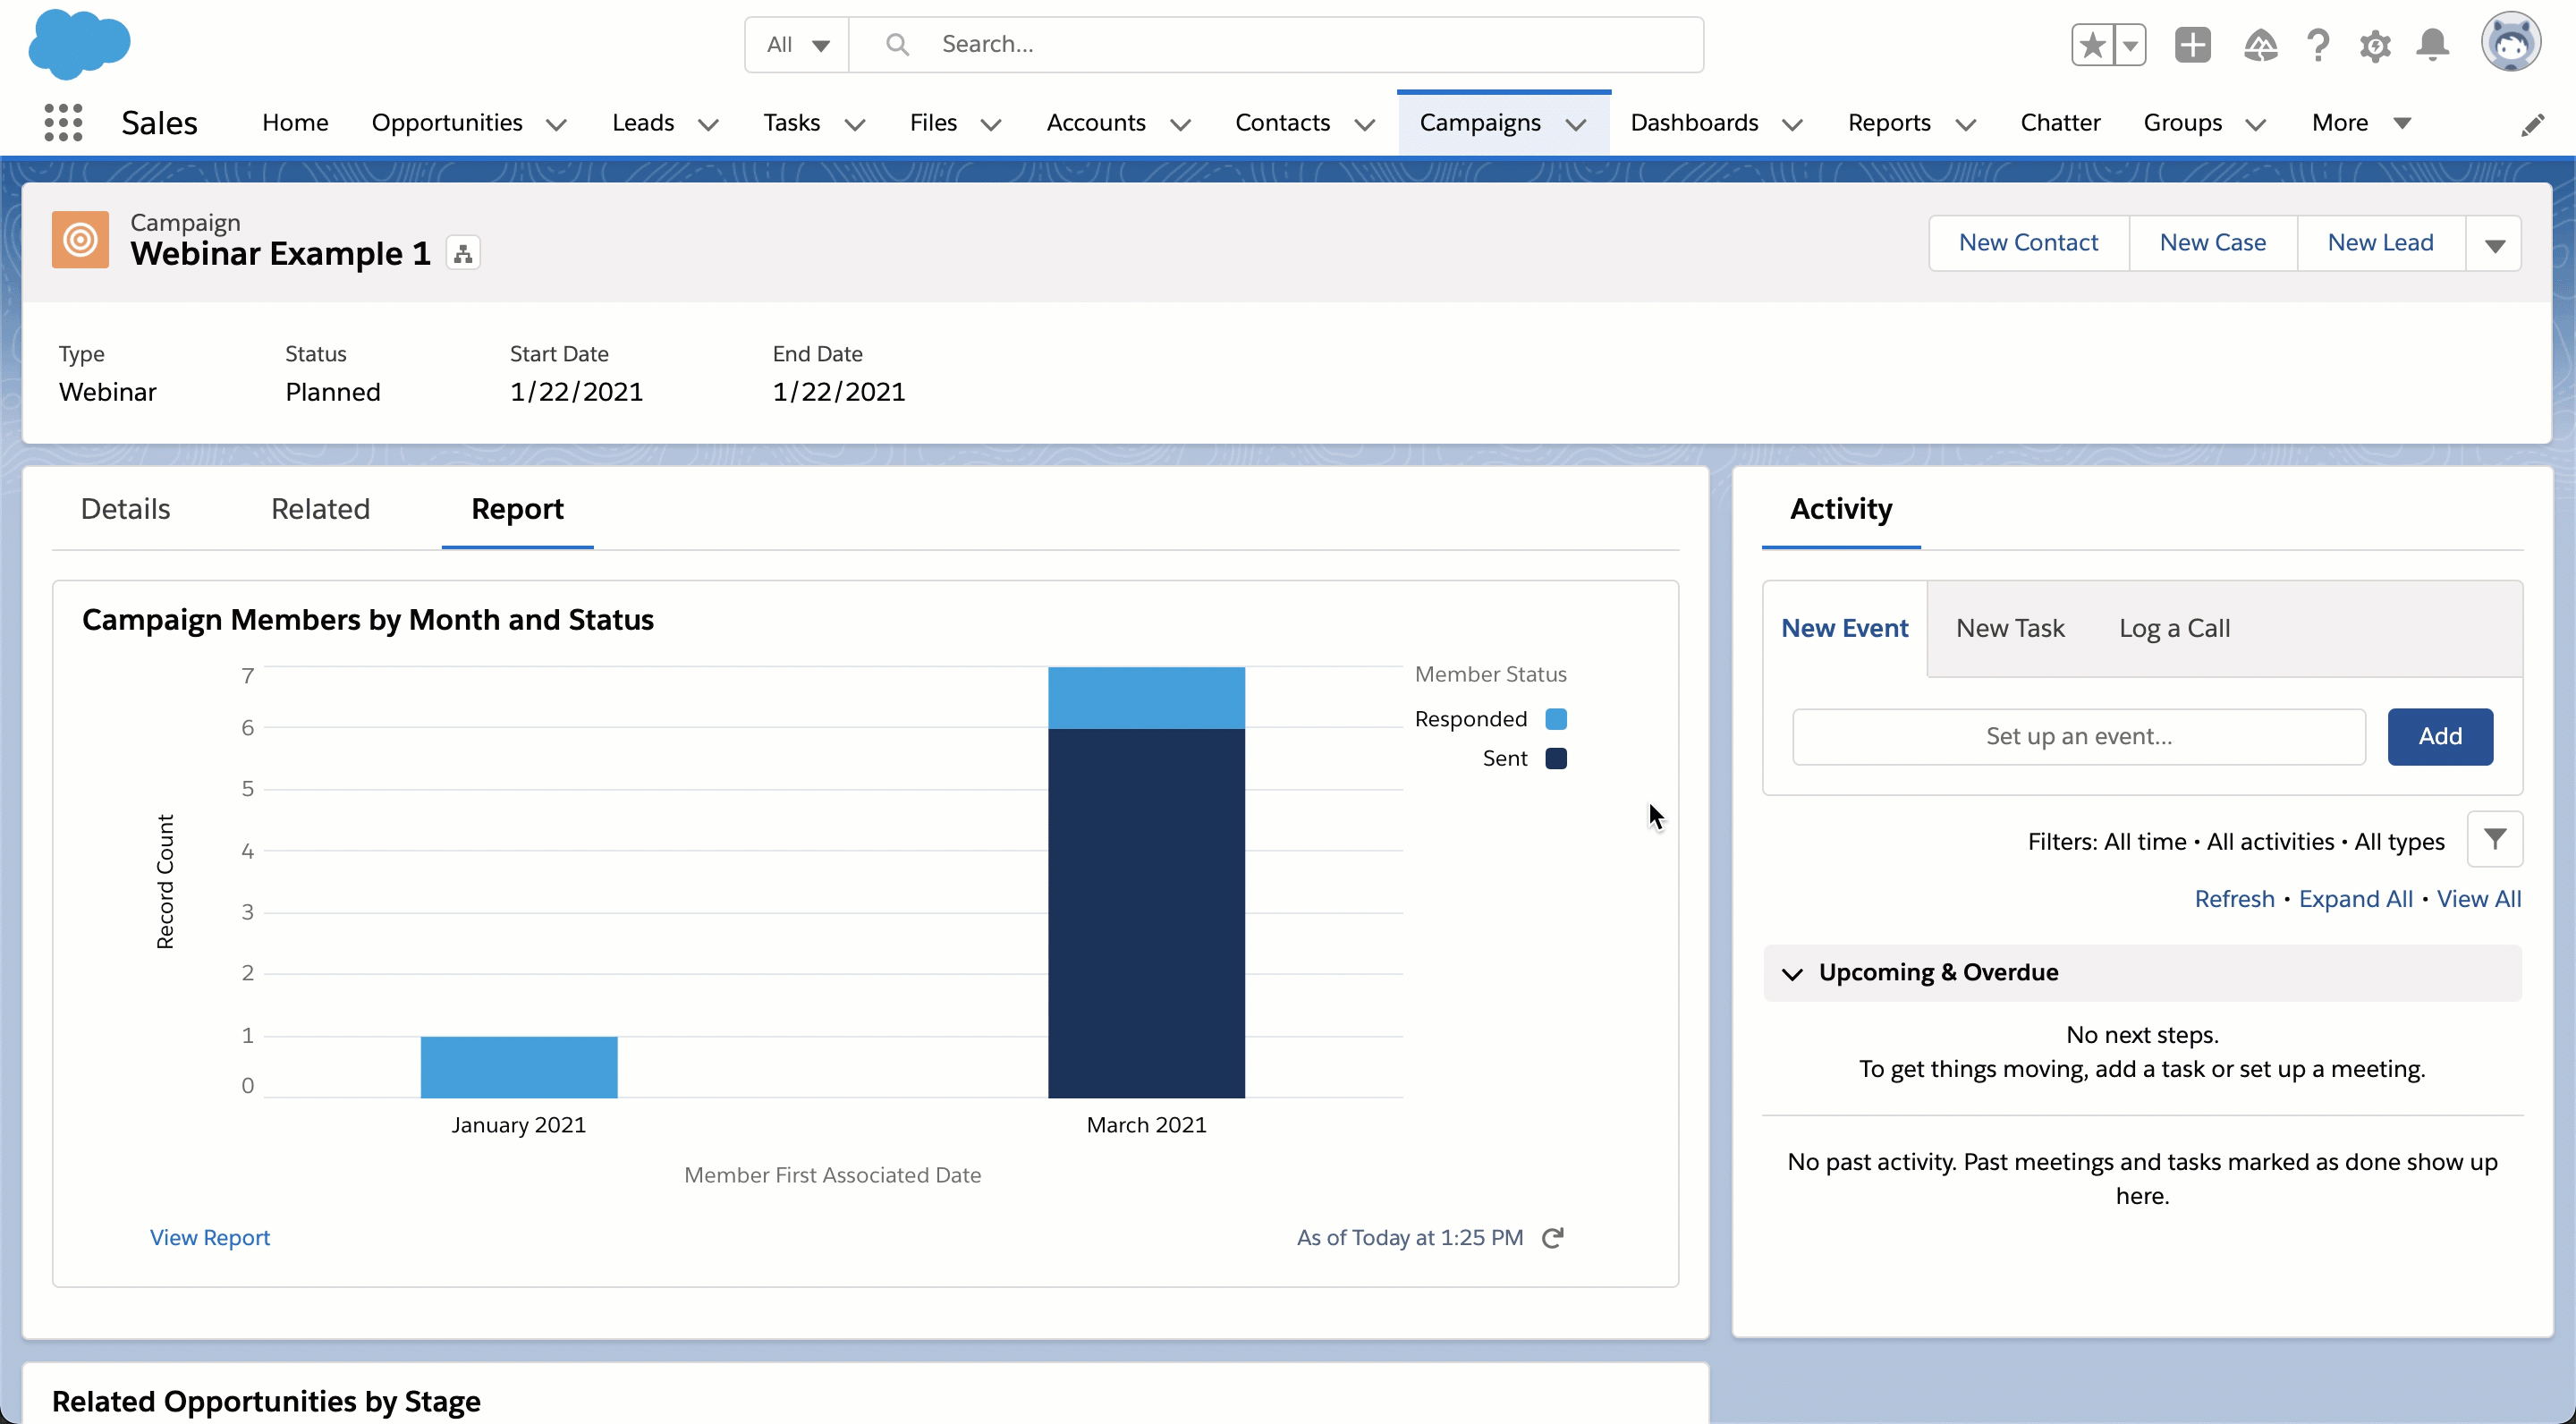
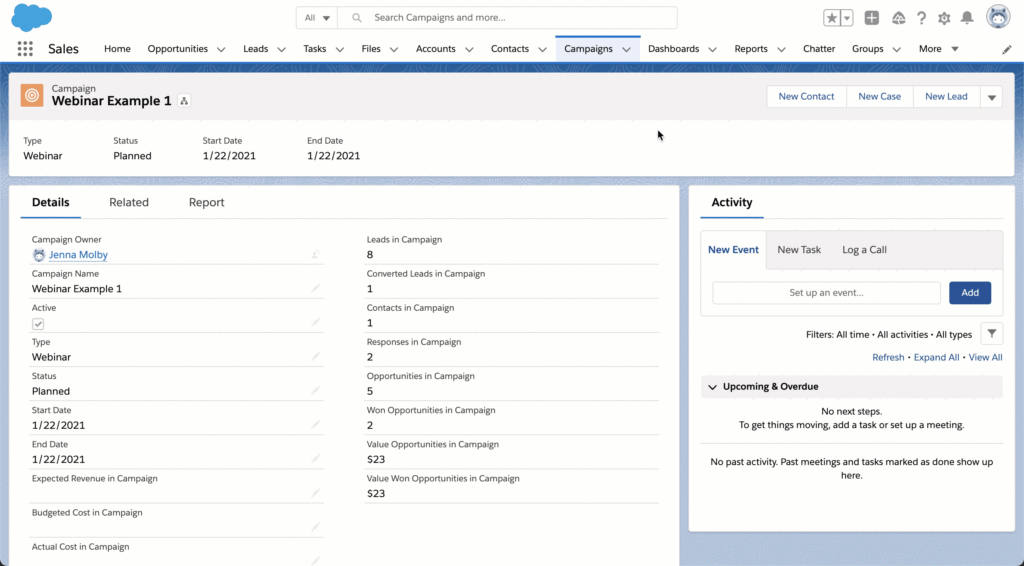
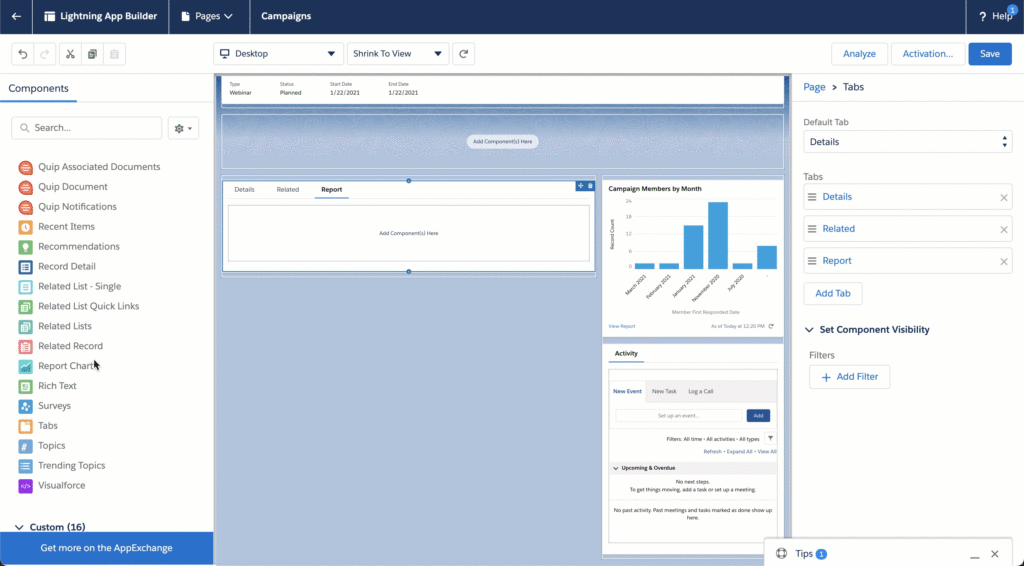
Here’s an example of a campaign that has a separate reports tab containing report charts.
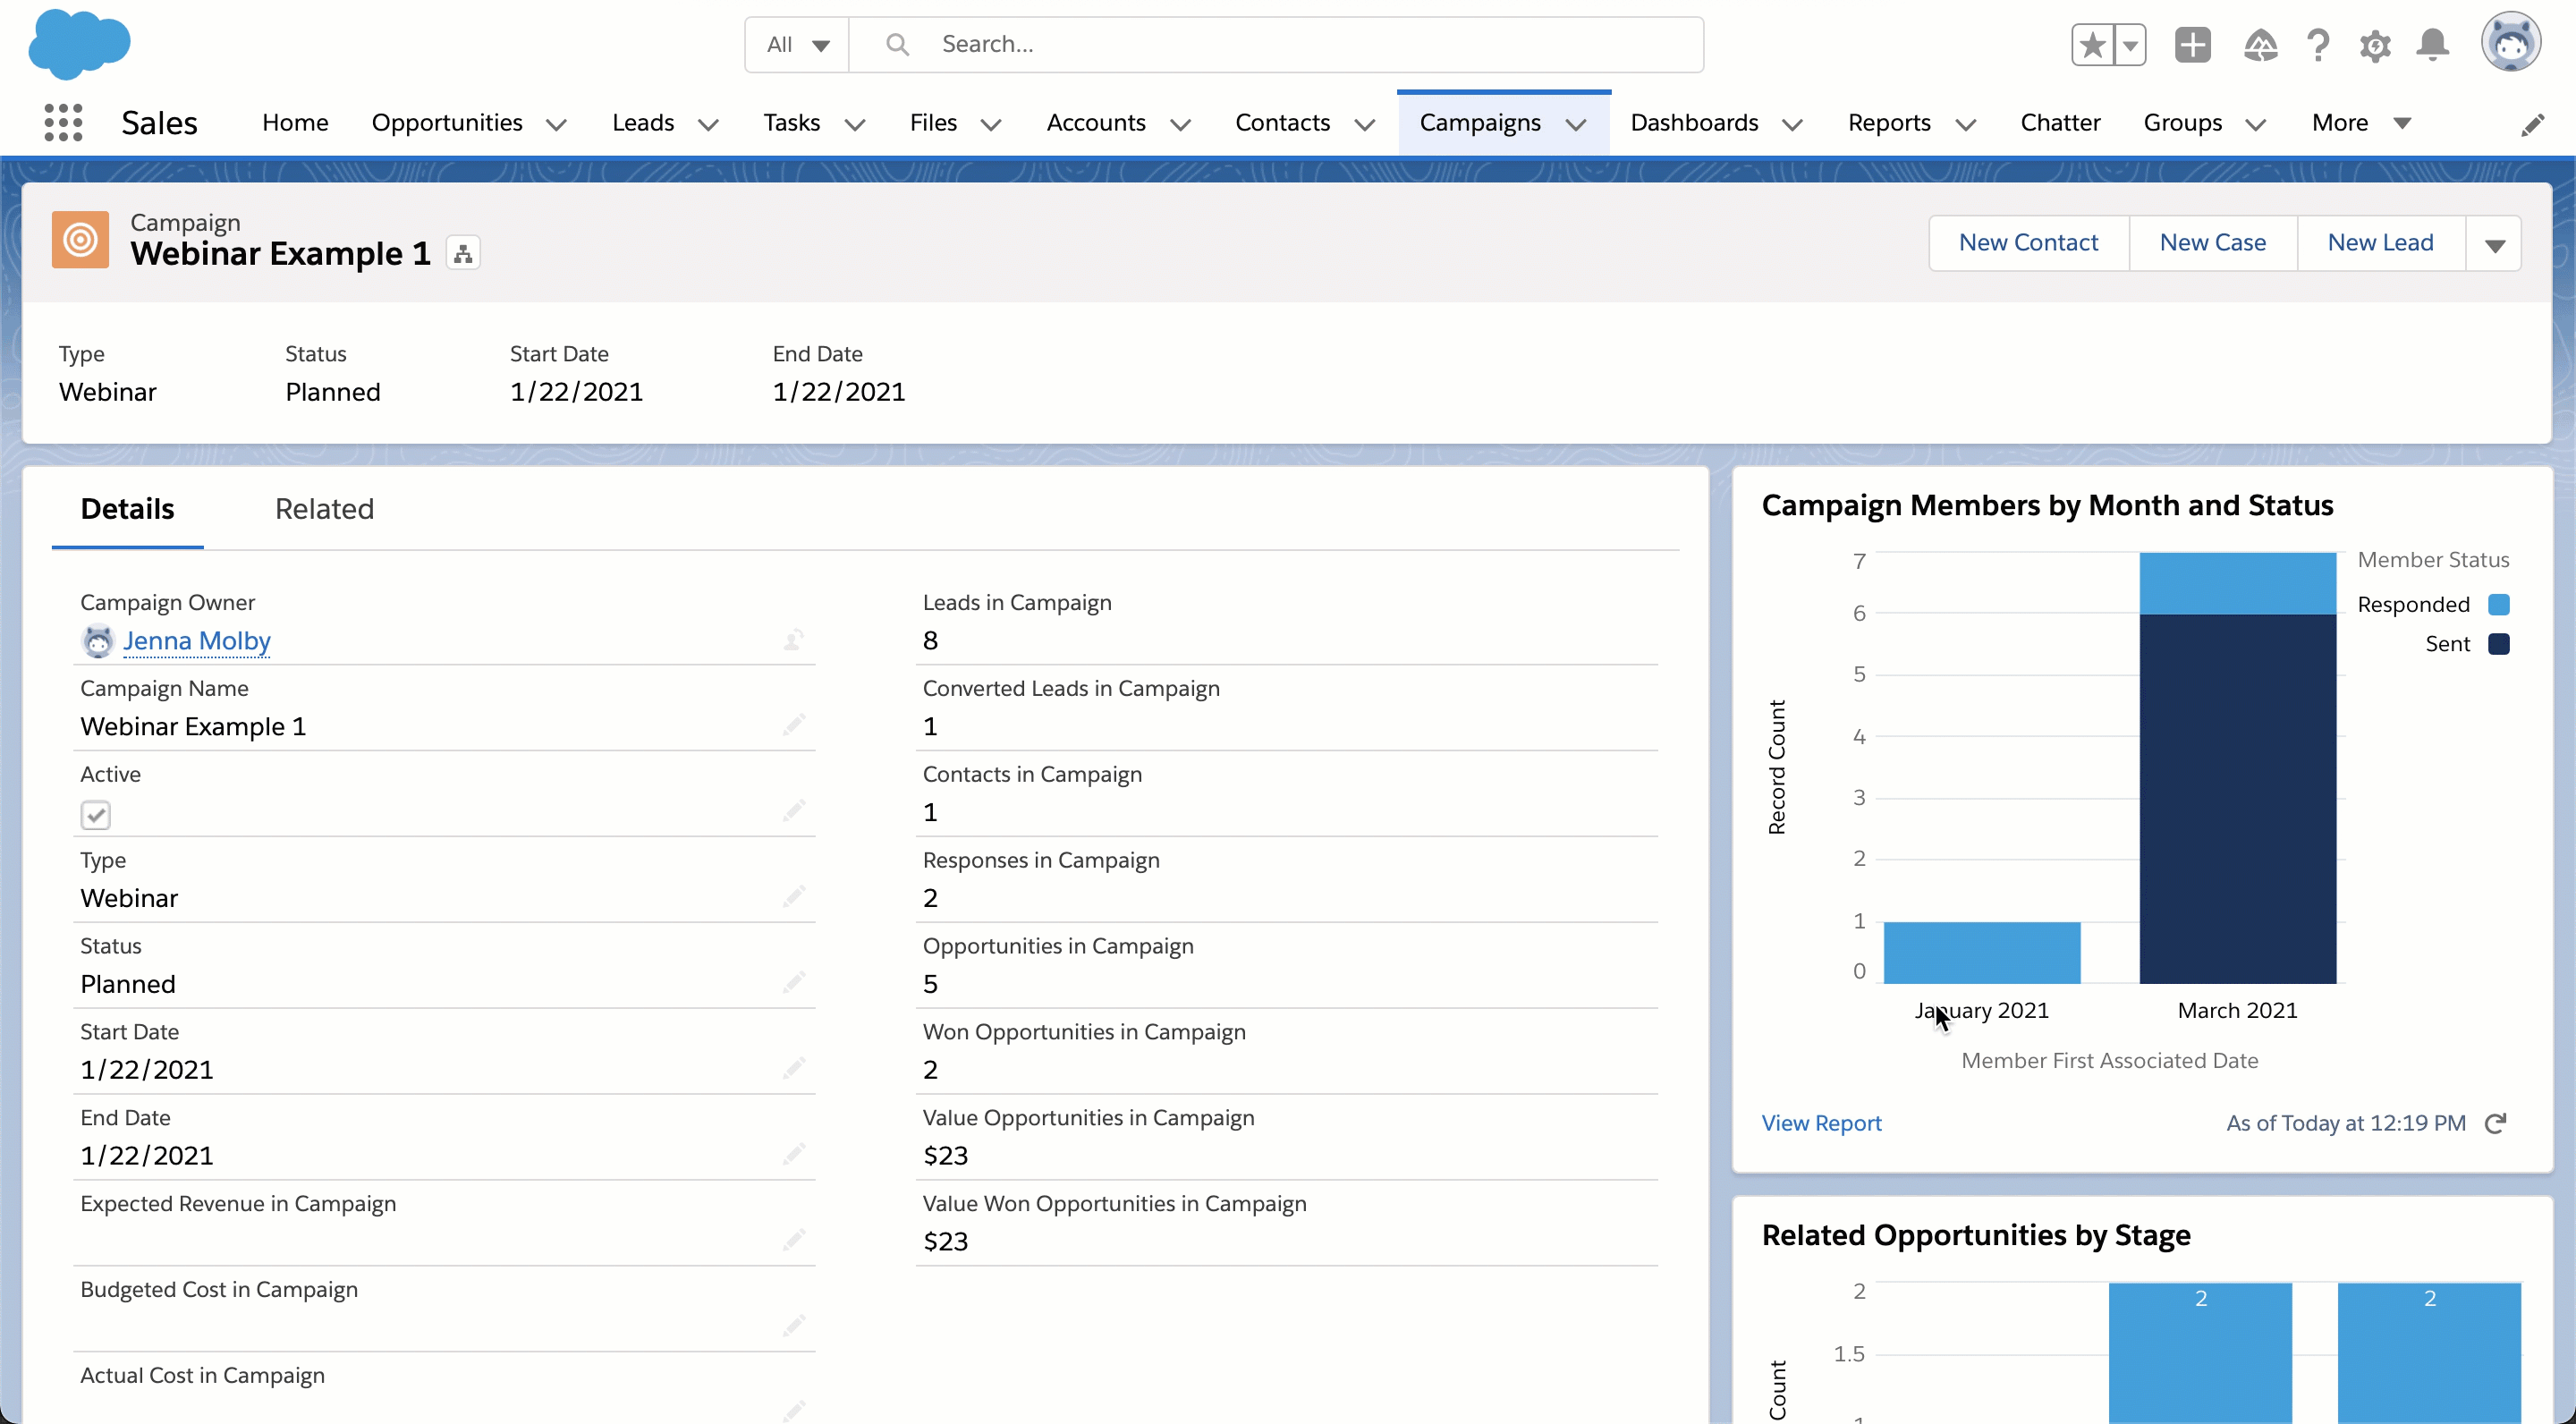
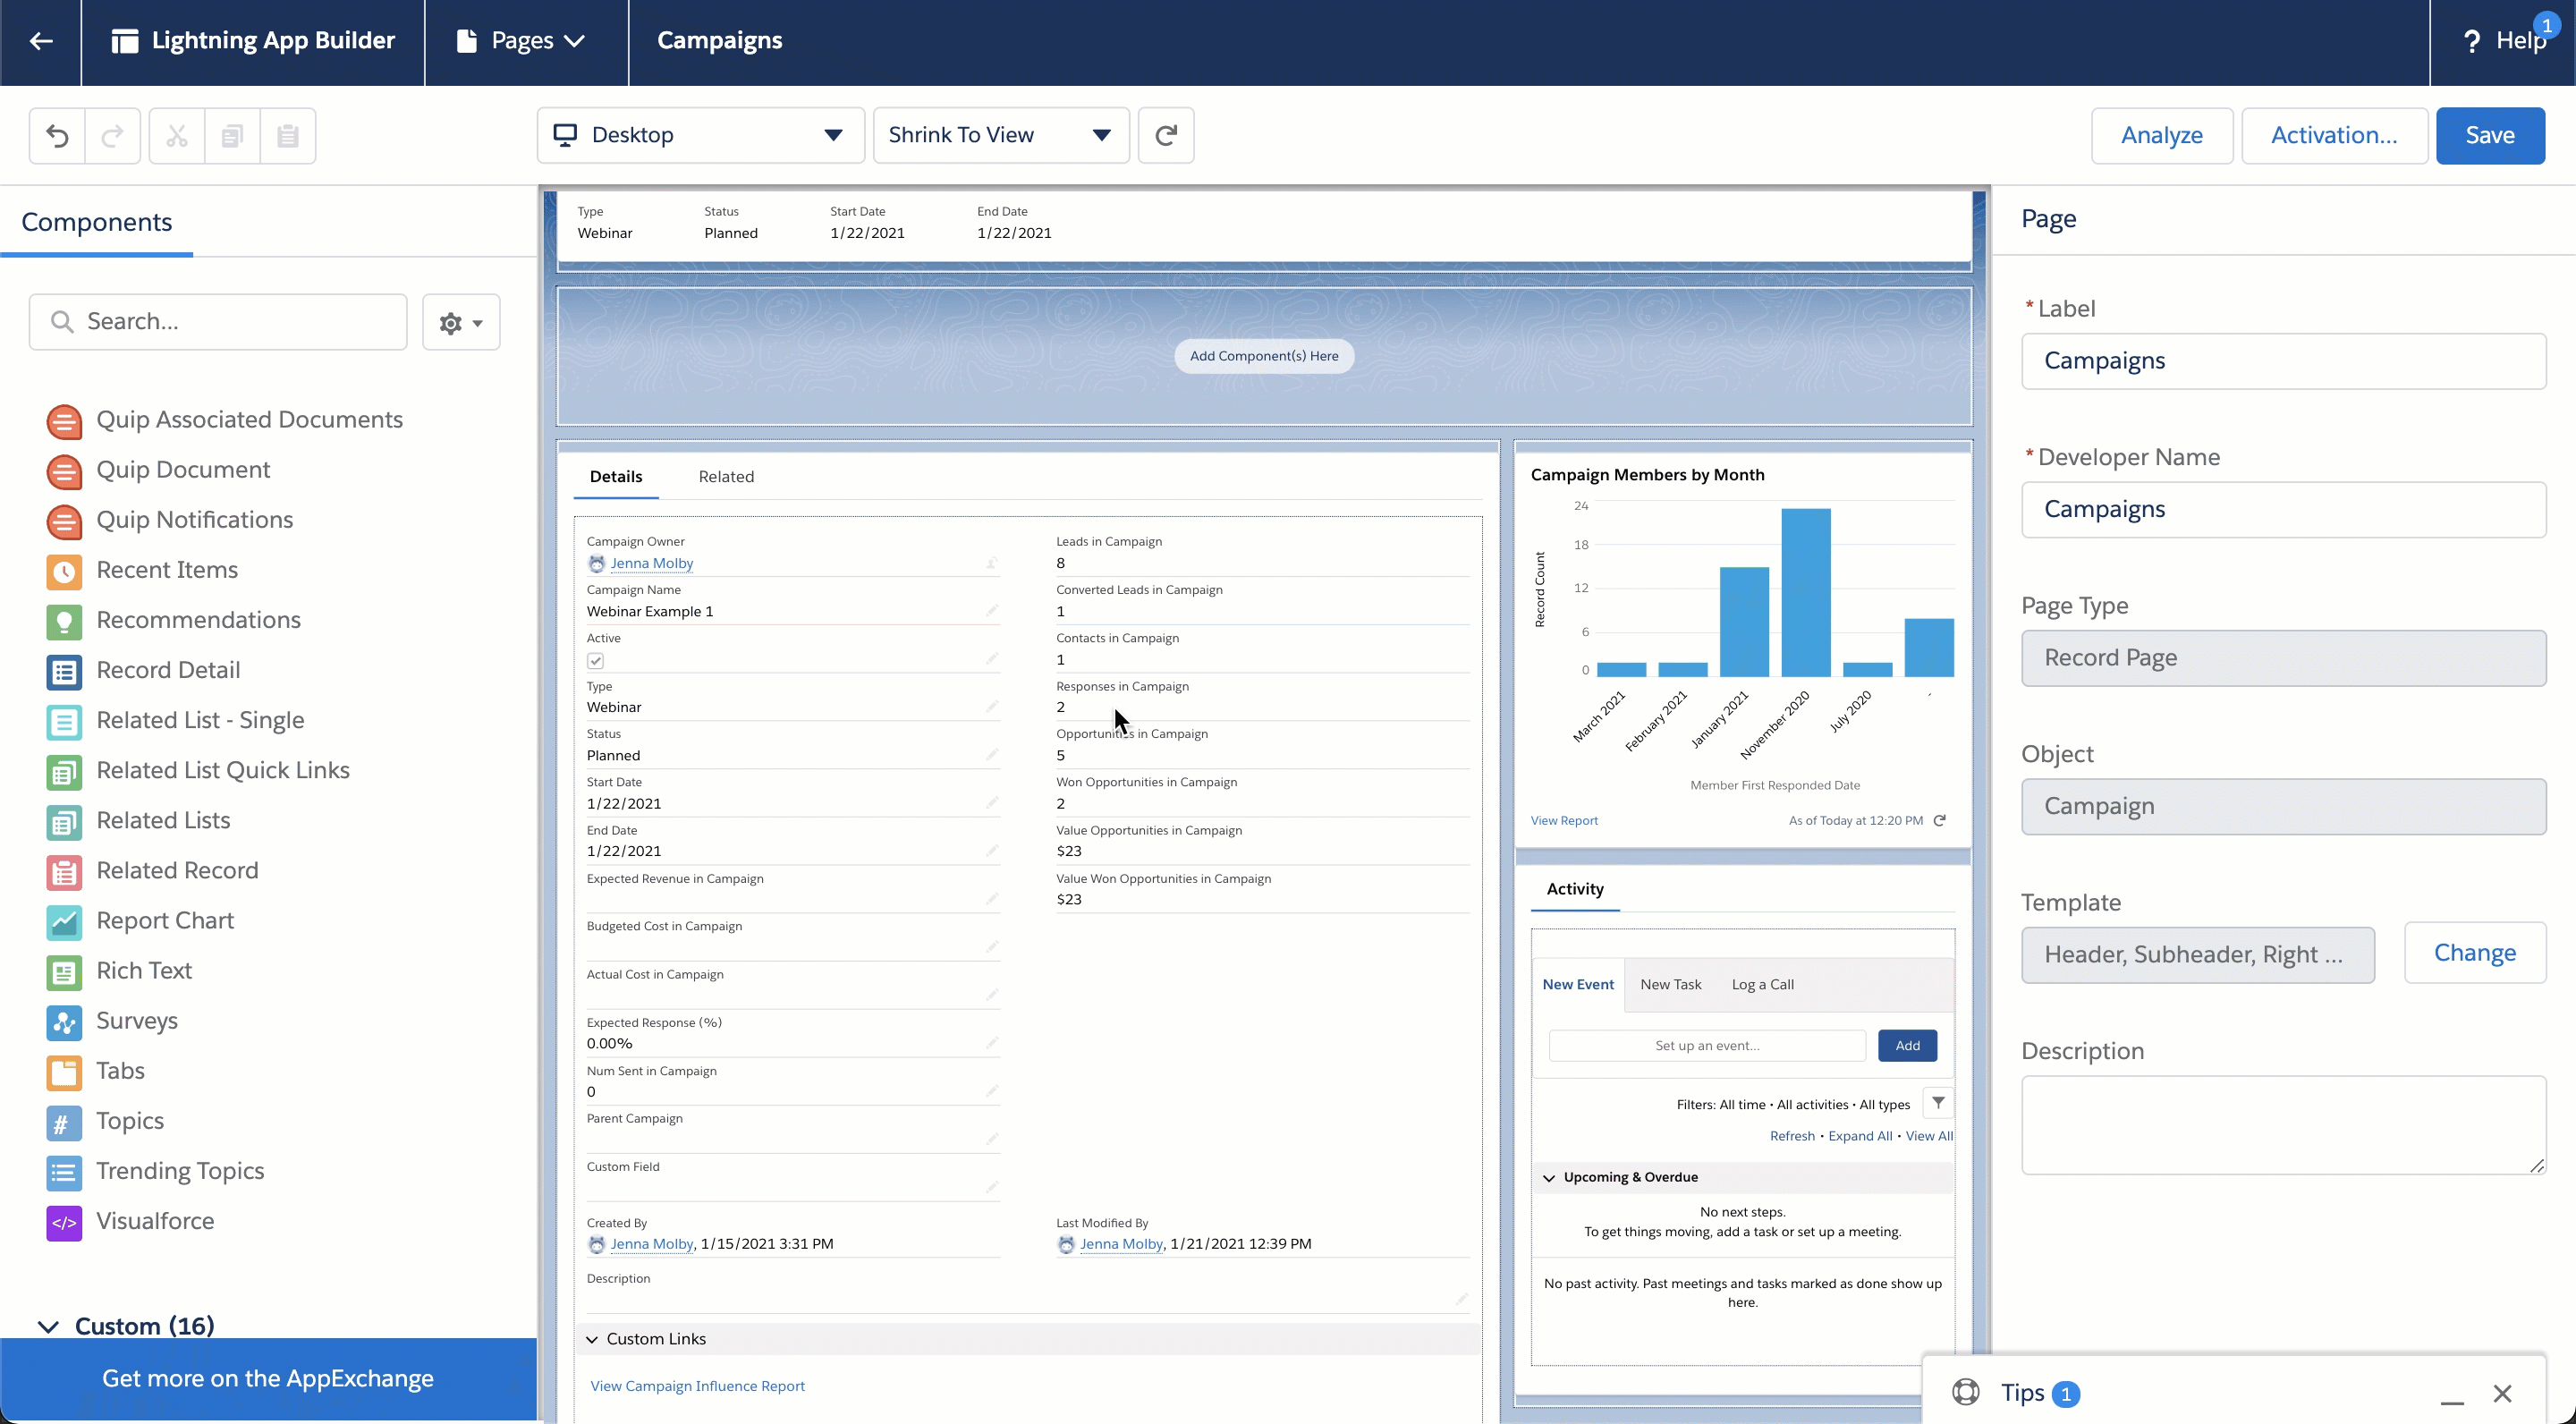
This example has the report charts directly on the page instead of a new tab.
Step 1: Create the reports
The first step is to create the reports you want to add. There are two things to keep in mind when creating your reports:
- Only reports with charts are available to add to campaign page layouts.
- The reports must be saved within a public folder in order to add them to the page layout.
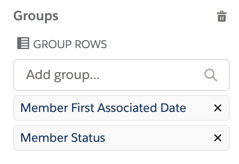
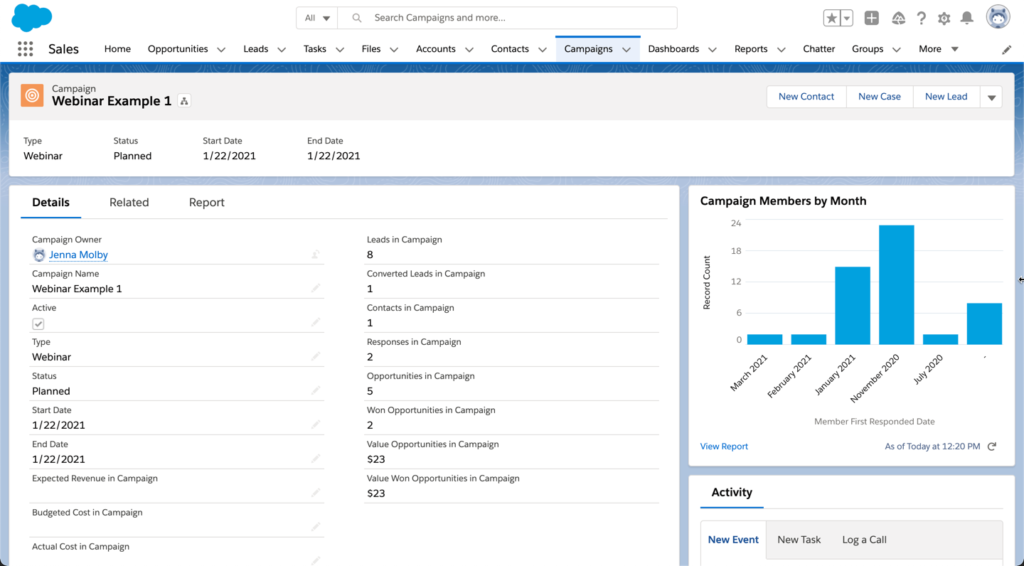
Example: Campaign members by month and status
When added to the page layout, this report will show a chart of all the campaign members (leads & contacts) by status and by month.
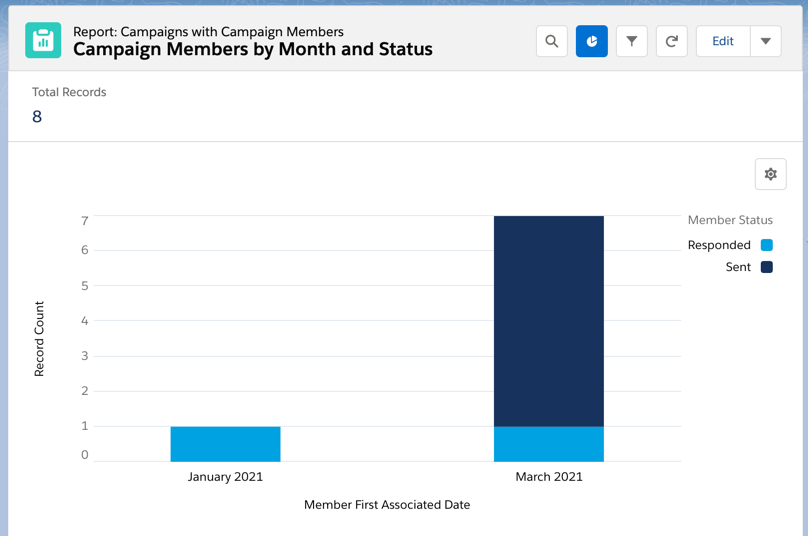
The report type is campaigns with campaign members, and the report is grouped by member first associated date and member status.
Example: Related opportunities by stage
When added to the page layout, this report will show a chart of all associated opportunities by opportunity stage.
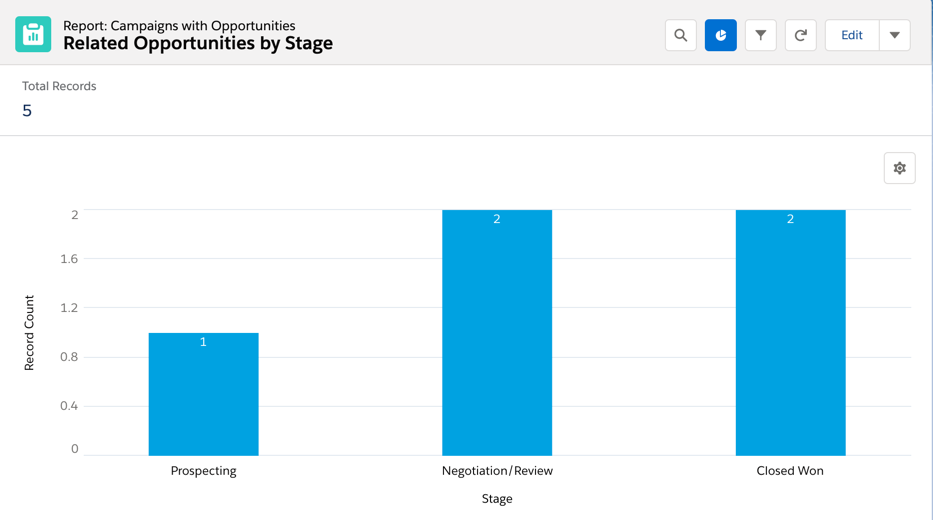
The report type is campaigns with opportunties and the report is grouped by stage.
Step 2: Add the reports to the campaign page layout
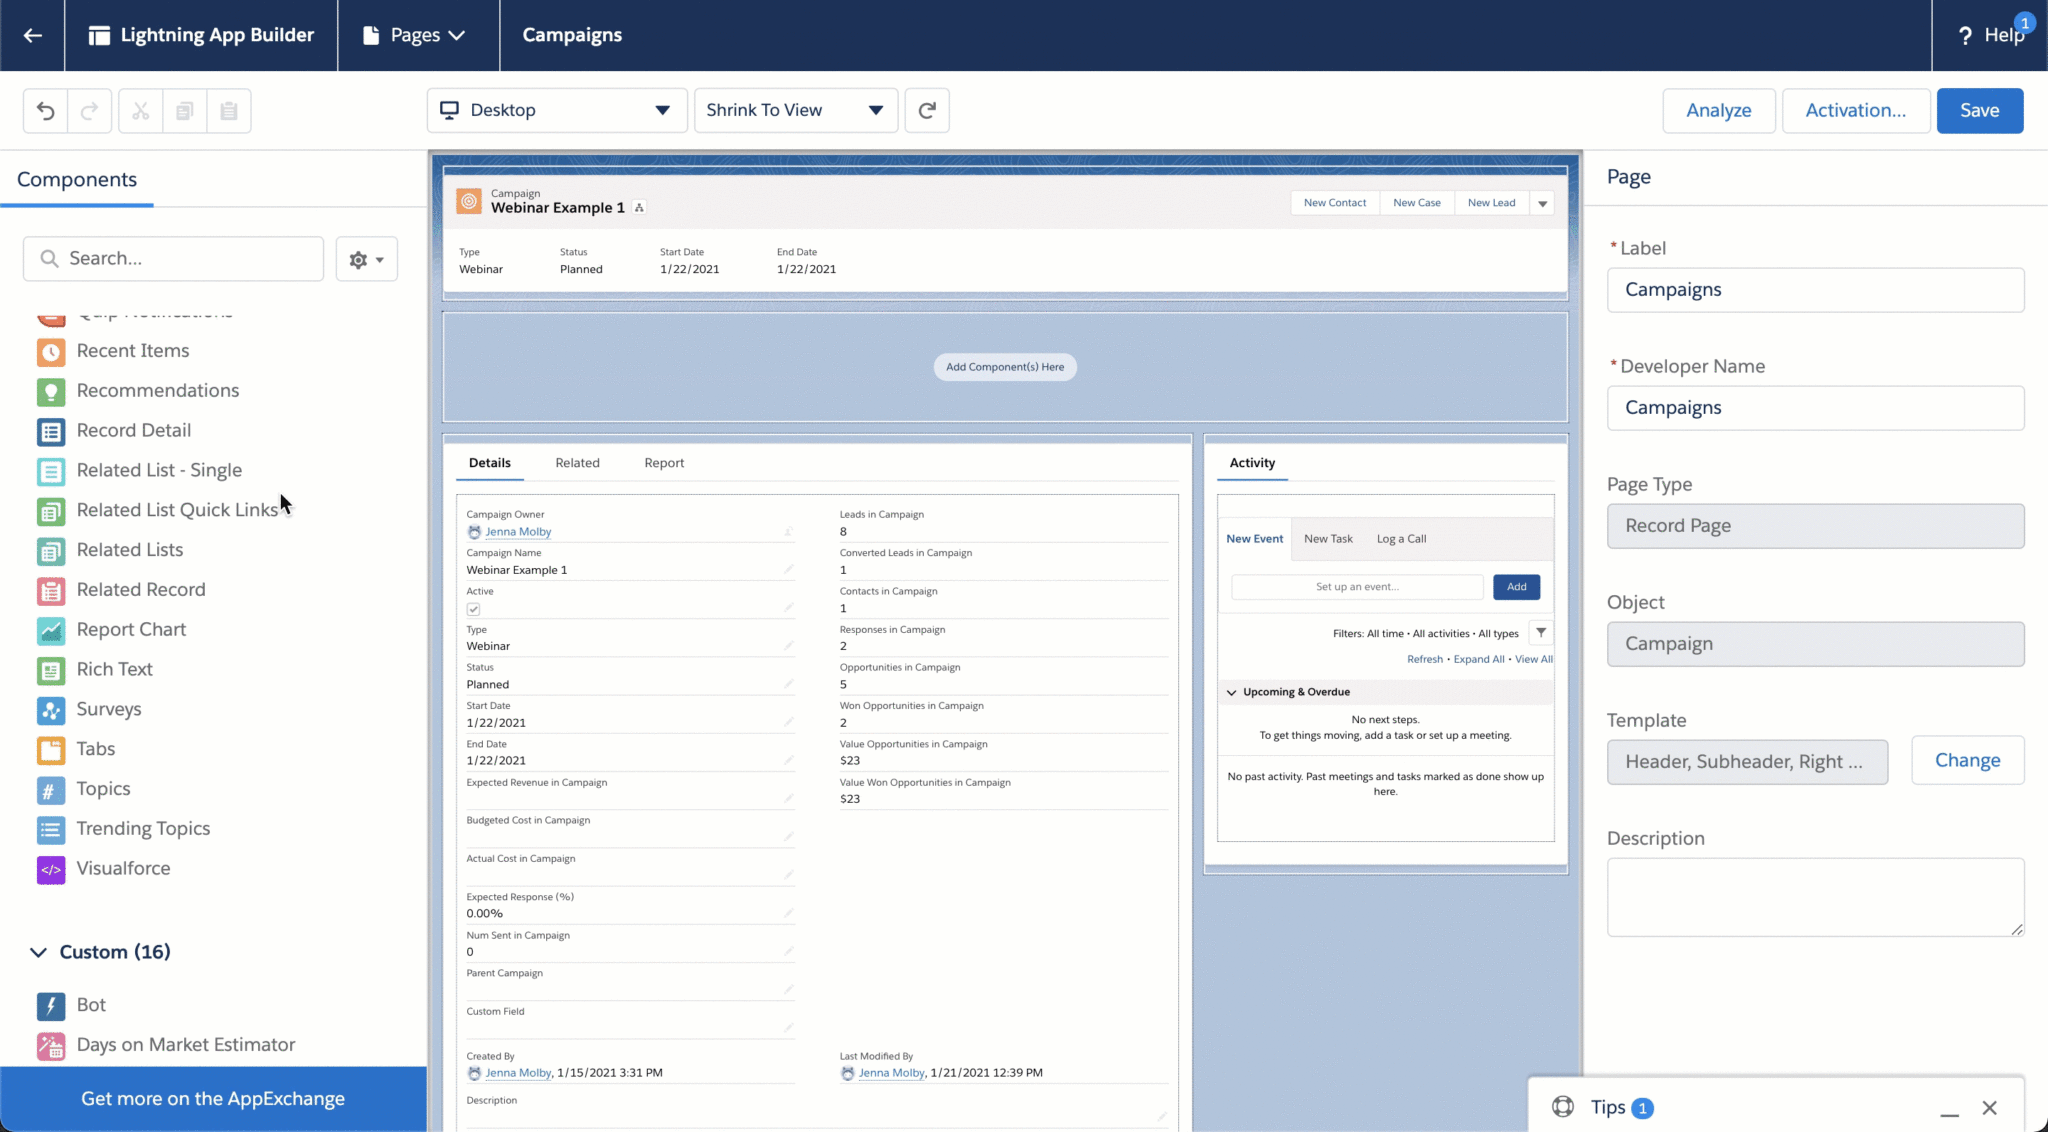
Now that your reports are created, you can add them to the campaign page layout. Navigate to one of your Salesforce campaigns, click on the gear icon, and click on edit page. This will take you to the Lightning Page Builder.
Note: Editing the page will overwrite the existing page. You might want to create a new custom record page instead of overwriting an existing page.
Drag & drop the report chart component anywhere on the page.
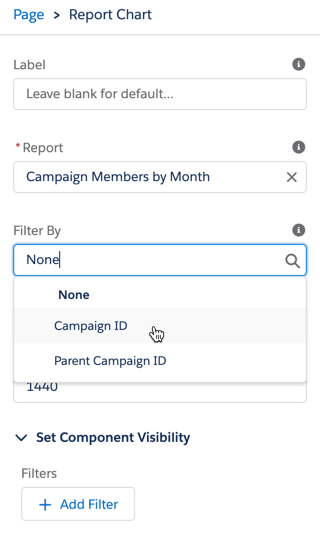
Select your report from the panel on the right. Add a filter for either campaign ID or parent campaign ID.
You can also add reports to a new tab within the page layout. To do this, click on the tab group, and click the add tab button. Click on the name of the new tab and select report from the menu.
Drag & drop the report chart element to the report tab to add your reports.
Save the Lightning Page and navigate to a campaign to see your reports in action!
Questions?
Send me a tweet @jennamolby, or contact the Sercante team for help.